Thursday, December 18, 2014
Weaver: a new dynamic graph framework
My friend Yaron Weinsberg sent me a link to Weaver, a new dynamic graph framework from Cornell.
Wednesday, December 17, 2014
Minerva: open source deep learning on GPU software from MS
Tuesday, December 16, 2014
Bitcoin conference: Jan 27, SF
My friend and colleague Ben Lorica, chief scientist of O'Reilly Media never rests.. Now how organize an interesting BitCoin related one day conference on Jan 27 in SF.
Readers of this blogs are welcome to use discount code USGR20.
Readers of this blogs are welcome to use discount code USGR20.
Intel Xeon-Phi is trying to catch up on NVIDIA
I got this article from my colleague Matt from Walmart:
http://hips.seas.harvard.edu/
it seems that Intel is trying to catch up on NVIDIA by creating tools for GPU processing.
NVIDIA has some opinion on Intel's effort which is listed here.
http://hips.seas.harvard.edu/
it seems that Intel is trying to catch up on NVIDIA by creating tools for GPU processing.
NVIDIA has some opinion on Intel's effort which is listed here.
Friday, December 12, 2014
Hardcore data science
My friend and colleague Ben Lorica, just sent me a link to the hardcore data science track is his organizing at Strata San Jose. Super interesting topics - in addition, you are welcome to use discount code DATO20 when registering.
Tuesday, December 9, 2014
GraphLab's deep learning - the power of graph applied to images
GraphLab's deep learning - the power of graph applied to images
A couple of months ago we have released a deep learning toolkit for GraphLab Create. We just got a code contribution from Marian Moldovan & Enrique Otero, from Beeva.com, which utilizes GraphLab deep learning toolkit in a new and exciting ways.
Marian & Enrique created a super awesome application. Imagine you have a repository of images and you would like to understand the relation between the images. The images they used are of buildings in Barcelona, as this work was created at the hacknight of papis.io, a predictive API conference in Barcelona.
Here is the first building:

And here is the second building:

What is the architecture transition that can explain this path? Using GraphLab Create it is easy to compute!
In a nutshell, they first extracted images features using the deep learning toolkit. Then they used a nearest neighbor model to create a graph of all the similar buildings:

Next, they used the graph model to find the shortest path between two interesting buildings (number 16 and 23)


Marian & Enrique created a super awesome application. Imagine you have a repository of images and you would like to understand the relation between the images. The images they used are of buildings in Barcelona, as this work was created at the hacknight of papis.io, a predictive API conference in Barcelona.
Here is the first building:
And here is the second building:
What is the architecture transition that can explain this path? Using GraphLab Create it is easy to compute!
In a nutshell, they first extracted images features using the deep learning toolkit. Then they used a nearest neighbor model to create a graph of all the similar buildings:
Next, they used the graph model to find the shortest path between two interesting buildings (number 16 and 23)
| The Ipython notebook to reproduce this example is available here. |
Friday, December 5, 2014
Deep learning startup raises 8M$ round A
Fresh news from my colleague Chris Debois. Richard Socher's new startup MetaMind just announced 8M$ for forming a deep learning based solution company. So far they have two functionalities: identifying objects in images and classifying text.
Readers of my blog may recall that a year ago I have already written about etcml, the project which is now the basis of this new startup.
A related company is Alchemy which provides an API for performing similar tasks. The same with Clarifai.
Other related companies are Superfish, which finds similar photos of pets, decor and clothing, as well as Cortica who identifies objects in images. The difference is that MetaMind provides tools for developers and not an end application.
By the way, in GraphLab we also provide deep learning functionality.
Sunday, November 30, 2014
Google identifies content in images
I got this from my collaborator Tianqi Chen: a blog post from Google which describes their recent progress in identifying content in images and describing it using text sentences.

Some relevant papers which describes those techniques are mentioned in this ycombinator blog, I got from my collaborator Chris DeBois.
Some relevant papers which describes those techniques are mentioned in this ycombinator blog, I got from my collaborator Chris DeBois.
Saturday, November 29, 2014
Graph Tool: Interesting graph analytics library in python
I learned about Graph Tool from Shlomo Yona from F5 Networks. Look like an interesting python package for graph analytics.
Deep learning lecture by Yann Lecun
A couple of weeks ago I attended TLV deep learning master class, organized by Prof. Lior Wolf from TAU. The highlight of the day was a tutorial lecture by Yann Lecun about this domain. Anyone who is looking to better understand this domain is advised in watching this lecture, that was just released in video:
The Unreasonable Effectiveness Of Deep Learning


The Unreasonable Effectiveness Of Deep Learning
Sunday, October 19, 2014
Interesting dataset from Ancestry.com
Was released in Strata NY. It contains US family records from 1820 onwards. The only data which is anonymized is the last name, all other details are true.
Here is a link.
Here is a link.
Apache flink
Saturday, October 11, 2014
News from Recsys - GraphLab Create based solution wins second place
Yesterday I met Robi Palovicz at ACM Recsys. Robi is a PhD from The Hungarian Academy of Sciences, supervised by my friend and Colleague Andras Benczur. Robi was leading the team who won 2nd place at the Recsys challenge 2014.

His solution was based on Graphlab Create, and more interesting, it takes only 30 seconds to compute the winning solution with GraphLab Create!
Robi have promised to share their winning solution using an Ipython Notebook. Once it is ready we will publish it on our website and I will post a note here.
Friday, October 10, 2014
Microsoft Research Mountain View Shuts Down- What is going on in Microsoft??
I was an intern there in 2006 under Prof. Dahlia Malkhi - a great research center with some of the leading CS scientists like Leslie Lamport. Recently Microsoft has gone crazy and shutdown their center.
I hear that Facebook and others are celebrating. Everyone is trying to hire those guys.
I hear that Facebook and others are celebrating. Everyone is trying to hire those guys.
Thursday, October 9, 2014
Join us this Tuesday in NY: GraphLab Users Meetup - October 14, 19:00 at Knewton
Here is our full meetup agenda. Anyone in the vicinity is welcome to attend!
Tuesday, September 30, 2014
Datapad - Acquired!
Great job Wes!
Monday, September 22, 2014
Tuesday, September 16, 2014
Interesting all pairs similarity search paper from Google
 I got a link to this paper by Ira Cohen, Co-Founder and Chief Scientist of Anodot. The paper full title is:
It seems like a simple method which works well when the compared pairs of vectors are sparse. It is also accompanied by open source code.
Friday, September 5, 2014
Machine learning postdoc position in Paris
My colleage Florent Krzakala from the Ecole Normale in Paris is looking for a postdoc in the area of statistical inference and machine learning.
Wednesday, September 3, 2014
First workshop on software engineering for machine learning announced
My colleague Xavier Amatriain from Netflix is organizing this NIPS workshop: first workshop on software engineering for machine learning. Paper submission deadline is October 10. Workshop will be held December 13 as part of NIPS conference.
Tuesday, September 2, 2014
PNNL Cyber Security Project Utilizes GraphLab

Guest blog post by Sutanay Choudhoury, Senior Research Scientist @ PNNL:
There is a growing emphasis on "resilience" in the cyber security community today, signifying a shift from the adversarial detection mentality. Cyber defenders are always at a disadvantage with respect to the attackers due the large number of strategies an attacker may pursue, and sophisticated hackers successfully disguise their behavior as normal activity. Resilience is defined as the ability of an enterprise to keep its infrastructure functioning even in the face of impediments such as attacks, power failures. Our world relies on interconnected data, services, and computing resources. Failure in any part of the system could have disastrous consequences on the rest of the system.
The M&Ms4Graphs (Multi-scale, Multi-dimensional Graph Analytics for Cyber-Security) project at Pacific Northwest National Laboratory, USA uses graph-theoretic models to provide continuous updates on system states as part of enabling a resilient cyber infrastructure. By studying information flows modeled as large-scale dynamic graphs, this project developed a multi-scale framework that can account for behaviors spanning from individual machines to enterprise levels within a cyber system. M&Ms4Graphs uses GraphLab as a major building block in the underlying computation layer. The application has three distinct layers:
1) Graph Models: Building graph models from Cyber data. This layer builds weighted graphs with labeled and attributed nodes and edges from network traffic, event log datasets. Graphs from here feed into (2).
2) Graph metrics: We compute a set of graph theoretic metrics using GraphLab (triangle counting, pagerank, k-core decomposition, SVD) and our own codebase (aggregation, frequent subgraph mining, agglomerative clustering).
3) Cyber metrics: The graph theoretic features from (2) feed into another set of algorithms that are computing more abstract/cyber focused metrics. Examples include algorithms for role mining (learning behavioral models), topological strengthening (recommendations for changing the graph topology), computing network resilience etc.. At this point, this layer is mostly implemented in python/MATLAB.
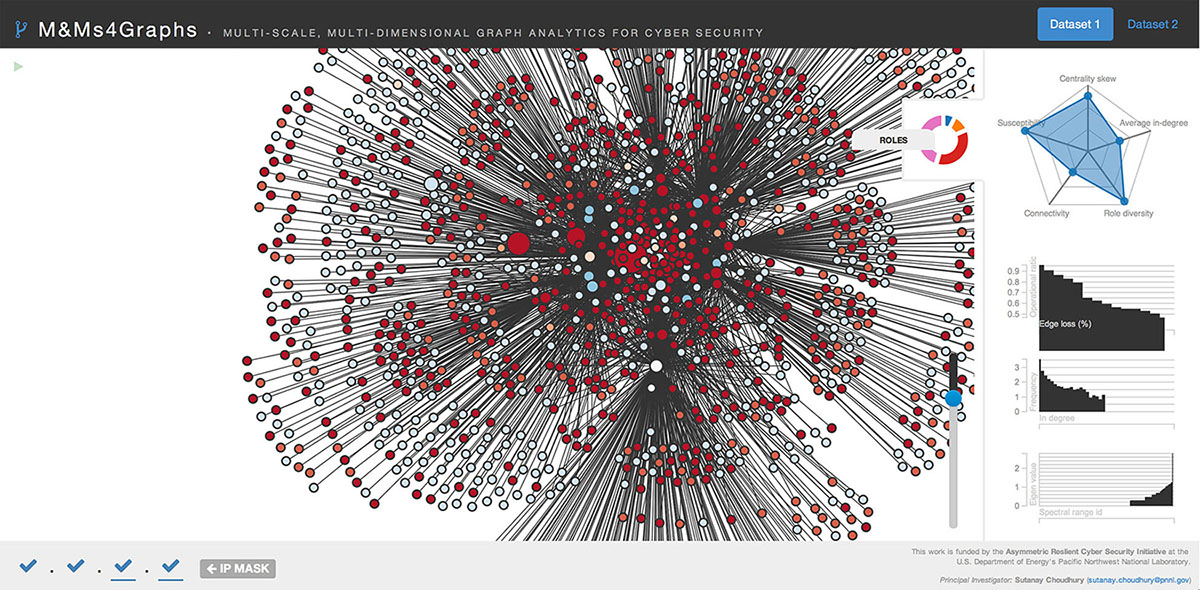
An online demo available at http://goo.gl/1iiqc6, show the machines in a cyber network. The machines are colored by their behavioral profiles, which are gleaned from the data. The polygon on the right summarizes important properties of the underlying data stream.
Friday, August 29, 2014
Scalable data science training in Seattle
Together with the University of Washington in Seattle, we are setting up a full day of scalable data science training using Graphlab Create, on Wed Sept 17. Anyone who is interested in welcome to register here, you are welcome to use discount code GLABER.
Thursday, August 21, 2014
Do you like "The Killings"? Dive into Seattle police data!
Here is an interesting blog post analyzing Seattle police data. I got it from Carlos Guestrin, our CEO.

Another interesting dataset is Allstate insruance claims data, which is from their Kaggle competition.
Another interesting dataset is Allstate insruance claims data, which is from their Kaggle competition.
Wednesday, August 20, 2014
GraphLab Create helps analyze FCC network data
My collaborator Scott Kirkpatrick from the Hebrew University is using Graphlab Create to analyze FCC broadband data. He is using GraphLab Create to slice & dice large corpus of network measurement data. Here are some resulting beautiful plots that illustrate network traffic from different aspects. The data is free, anyone who wants to look at the code is welcome to email me and I will share the ipython notebook to generate those plots.


GraphLab Create's Boosted decision trees for Kaggle Bike Sharing Competition
My collaborator Jay Gu has just released a blog post which explains how to use Boosted Decision Trees in GraphLab Create to compete in Kaggle's Bike Sharing Competition. Using this simple solution we get to place 15 in the leaderboard out of 569 competitors!
Sunday, August 17, 2014
DataRobot raises 21M$ series A
Just got this from my collaborator Jay Gu: DataRobot raises 21M$ in series A. A Boston startup who is trying to automate data science. According to this blog post, the invested was led by NEA, who also invested in Databricks (Spark) as well as GraphLab.
A related company is SparkBeyond, an Israeli startup who raised 4M$. They also automate data science by automatically generating features and evaluating them using multiple algorithms.
A related company is SparkBeyond, an Israeli startup who raised 4M$. They also automate data science by automatically generating features and evaluating them using multiple algorithms.
Tuesday, August 12, 2014
Interesting paper from Dataiku about WCSD 2014
Dataiku recently won first prize at the Yandex WCSD 2014 competition. Here is a paper describing their methodology. Dataiku was recently present at our GraphLab Conference. They have a visual Excel like environment for data manipulation, cleaning and predictions.
Friday, August 8, 2014
Sparse K-means
I got from my collaborator Jay Gu the following recent paper: A Single-Pass Algorithm for Efficiently Recovering Sparse Cluster Centers of High-dimensional Data from ICML 2014. Basically it is K-means with L1 constraint on the cluster center. The results are sparse cluster centers, which may sense for example when clustering text documents together.
A second relevant paper I got from my collaborator Yao Wu is
Web-Scale K-Means Clustering by Scully from Google Pittsburgh. The paper uses mini batch to speed up computation and achieve sparsity using project gradient ascent.
A second relevant paper I got from my collaborator Yao Wu is
Web-Scale K-Means Clustering by Scully from Google Pittsburgh. The paper uses mini batch to speed up computation and achieve sparsity using project gradient ascent.
Tuesday, August 5, 2014
Misc News
Collaborative filtering tutorial by Netflix
I got this from my collaborator Alice Zheng, a lecture about collaborative filtering by Xavier Amatriain from Netflix at the MLSS summer school organized by Alex Smola at CMU:Deep learning @ Spotify
I got the following from my colleague Zach Nation: An Interesting blog post from Spotify about convolutional neural networks usage to learn latest factors for collaborative filtering. And here is the related NIPS paper.Cloud Service @ Databricks
Just recently Databricks has announced their business model: cloud service running Apache spark.
Here is the keynote at the Spark summit:
MapGraph: First Multi-GPU Graph Analytics System by Systap
I just heard from my colleague Bryan Thompson from Systap that they have recently released MapGraph: the first distributed graph analytics framework which supports GPUs. Here is their blog post giving additional details.
Tuesday, July 29, 2014
Sunday, July 27, 2014
MapGraph: speeding up graph processing with GPUs
The following paper about MapGraph was recently published at the GRADES workshop. It explains the basic construction Systap is using for speeding up graph processing on GPUs. (Systap is a bay area startup working on accelerating graph computation).
Wednesday, July 23, 2014
GraphLab Conference is a great success!
One picture shows it all - 700 data scientists assembled in SF for the 3rd GraphLab Conference

OpenGM graphical models toolkit
I learned from Kevin Murphy from Google about this interesting graphical model toolkit. So far it is not parallel but does have a lot of algorithms implemented on top.
Friday, July 11, 2014
10 days for large scale recommender systems workshop (LSRS) submissions
Submission deadline is July 21. We are looking for applied submissions (either in a short paper or a presentation format): http://graphlab.com/community/events/lsrs14.html
The workshop is part of RecSys 2014, a was the largest workshop last year.
The workshop is part of RecSys 2014, a was the largest workshop last year.
Wednesday, July 9, 2014
O'Reilly blog post about GraphLab Conference
Is here. I remind all the lazy people who did not register yet, they are welcome to use discount code: Dannysblog for getting 20% discount when registering. The event will take place on Monday July 21 at the Nikko Hotel San Francisco.
Thursday, June 26, 2014
Alice Zheng's GraphLab- O'Reilly Webinar is now online
 To anyone who wants to learn about the latest features of GraphLab - I recommend watching this useful webinar.
Sunday, June 22, 2014
Interesting taxi rides dataset
I got the following from my collaborator Zach Nation. NY taxi ride dataset that was not properly anonymized and was reverse engineered to find interesting insights in the data.
For the sport, I have used GraphLab Create to load and analyze this dataset. I started with an image of some NY taxis:
 Using GraphLab Create I was able to reverse engineer the anonymizaiton and query the data based on the medallion number (for example 8J77 for the lower left taxi in the image).
 I was further able to dig into personal details based on the medallion number:
 And finally ask questions like how much money the taxis in the image made in a certain week?
 Anyone who wants to try it out is welcome to email me, I can send you the ipython notebook to play with.
For the sport, I have used GraphLab Create to load and analyze this dataset. I started with an image of some NY taxis:
Monday, June 16, 2014
Be a detective with GraphLab create! Follow bitcoin money transactions to reveal a criminal!
Just got a note from my collaborator Brian Kent, who just related a new notebook which shows how to analyze Bitcoin money transactions using GraphLab Create. Using this notebook, Brian is trying to reveal a thief who stole 25,000$ Bitcoin money. Here is a graph of some of the thief transactions:
 To learn the rest of the story you will need to read the full notebook.
Related blog posts: Graph analytics is a promising tools for fraud detection and security. Recently, Cisco announced that GraphLab is part of their security stack. PNNL is using GraphLab for its cyber security projects. Lab41 (US gov. research lab) combines Titan and GraphLab for a powerful social graph analytic tool.
Related blog posts: Graph analytics is a promising tools for fraud detection and security. Recently, Cisco announced that GraphLab is part of their security stack. PNNL is using GraphLab for its cyber security projects. Lab41 (US gov. research lab) combines Titan and GraphLab for a powerful social graph analytic tool.
Saturday, June 14, 2014
Community detection survey by Lab41
Just got my hands on the community detection survey made by Lab41. A very comprehensive overview of the popular and useful methods to know. Some of the included methods are Girwan Newman, Infomaps, Fast Unfolding, Cesna and many more.
One of the interesting algorithms is BigClam:
One of the interesting algorithms is BigClam:
Friday, June 13, 2014
Lab41 releases open source code for GraphLab + Yarn integration
Just heard from Erik Tryzlaar from Lab41, that a new github open source project called Twill is alive. The project allows for running GraphLab tasks on a Hadoop 2.0 cluster which supports Yarn.
To remind, Pivotal have also their own wrapper which allows for running GraphLab on their Hadoop cluster, as part of their HD project.
A lot of exciting activities from different parties who are helping to make Graphlab Hadoop compatible! We will also release some news from GraphLab about this direction soon.
Fantastic talk by Dafna Shahaf - Stanford
This week I attended a great talk by Dafna Shahaf. In a nutshell, she has a method for finding surprising insights in the data. An open source project is on the way for sharing some of those tools.
Several applications domains were covered. For example, in the medical domain, two of the system findings (out of 4) are major medical breakthrough revelation as defined by external physician who examined the output. For commerce, the system can find surprising Amazon products to recommend to people. Here is a nice example:

For people who are looking for child's toys there are a lot of related selections in the pet section. For people who need a bath mat, there are related products in the car department which are much cheaper..
Several applications domains were covered. For example, in the medical domain, two of the system findings (out of 4) are major medical breakthrough revelation as defined by external physician who examined the output. For commerce, the system can find surprising Amazon products to recommend to people. Here is a nice example:
For people who are looking for child's toys there are a lot of related selections in the pet section. For people who need a bath mat, there are related products in the car department which are much cheaper..
Leading Cancer Hospital utilizes GraphLab LDA for HealthCare

From the KDnuggets blog post about this work:
"Among various techniques for understanding text corpus, we chose LDA topic models (implemented in GraphLab) because of its previous success in understanding scientific literature as well as webpages. We followed a process roughly as follows: data cleaning and standardization, topic modeling, clinical note clustering and visualization, community finding and cancer-gene correlation analysis. This process was mainly implemented by Katherine Chanunder my supervision. We had a few interesting findings, such as a community of patients who highly care about the risk of the treatment, the ability of predicting icd-9 code from topic modeling output, and some interesting correlations between patient profile and genetic mutation tests (some supported by previous published research)."
Subscribe to:
Posts (Atom)